.png?width=200&height=51&name=image%20(2).png)

This is a great guest blog by Ian Hendra from Clearline Services. This was first published in New Zealand's QNewZ back in 2013. It is still very pertinent now.
Dr Deming was a professional statistician. His world was the world of numbers, even though he believed that not everything was measurable. He taught us a great deal about the importance of controlling variation in processes so numbers always played a significant role.
Having said that, Dr Deming's 14 points for the transformation of management were all about engaging staff in the need to satisfy customers' expectations. Just hold that thought: just where does internal audit fit?

A picture paints a thousand words
Here is a tree diagram of a monthly performance report from my favourite company Buckett Enterprises Ltd. This style of reporting came my way via a couple of clients who used it every month for their periodic management review.
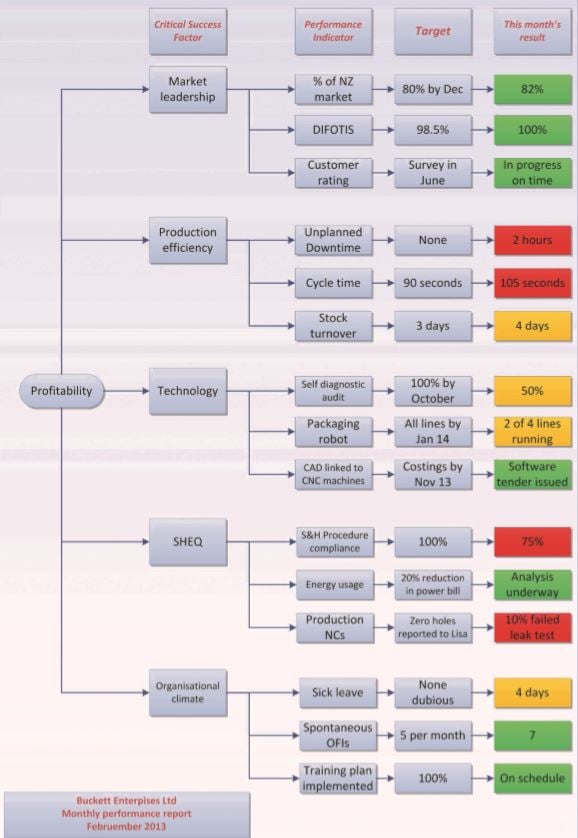
These clients had learned that lengthy reports were rarely read, often misunderstood and time consuming to prepare. So the diagram method solved three problems in one go; a picture paints a thousand words, almost literally!
Non-financial performance measurement
Whilst this tree diagram seems largely self-explanatory, I'm going to expand it here because I want to make a few points that relate to the intimate relationship between what we call quality management and what some call risk management.
The company's business plan had made it very clear that profitability was the goal for the whole management system, as indeed is the case for most business plans. That said, my observation over the years has been that financial performance has been the only method applied to monitoring the successful implementation of business plans.
The aspect that caught my eye all those years ago about this diagram was that its use not only excluded financial performance but also gave a clear line of sight across the whole operation. It struck a chord with me because non-financial performance measurement is very much the area in which we, quality professionals, do our work.
Five critical success factors
The business plan had thrown up five critical success factors for profitability that amounted to meeting the expectations of the three principal stakeholders, namely: owners, customers and staff.
Each critical success factor was broken down into performance indicators aligned with the business plan's targets, with the month's results reported against each.
1. Market leadership: as a focus on the risk of losing customers:
a) Market share as a measure of competitor activity.
b) Delivery performance measured as ‘delivery in full, on time and in specification’ percentage of overall supply.
c) Customer rating as per the results of a customer survey.
2. Production efficiency: as a focus on the risk to profitability of not optimising production cost:
a) Unplanned downtime for production equipment.
b) Cycle time has learned mean time for producing a bucket.
c) Stock turnover as a measure of inventory efficiency.
3.Technology: as a focus on using technology to improve operational efficiency:
a) Self-diagnostic audit (a new method for automated itself checking).
b) Packaging robot (a project to install robots on each line to automate packaging).
c) CAD link to CNC machines (a project to make production work directly from design drawings).
4. SHEQ: a focus on optimising those costs related to meeting Safety, Health, Environmental and Quality requirements:
a) Safety and health procedure compliance (because non-compliance costs money).
b) Energy usage (of her most significant environmental impact in this company).
c) Production NCs (nonconformity is arising during production; in other words failures to manufacture "right first time").
5. Organisational climate: a focus on the risks associated with an unhappy workplace:
a) Sick leave (looking for staff taking ‘sickies’).
b) Spontaneous OFIs (looking for staff engagement when it comes to making improvements in the workplace).
c) Training plan implemented (looking for an assurance that management are complying with training plans).
Point 1 - Quality systems relate to more than product conformity: In this diagram the word quality is used only with respect to product conformity. I believe professional quality systems take account of the full range of activities in this entire tree diagram.
Point 2 - Making more sense out of internal audit: It is clear that this tree diagram approach to non-financial management reporting directly addresses the concept of risk; that is to say that the effects of uncertainty in delivering the expectations of the principal stakeholders.
Tying It All Together
Over the years many of us quality professionals have struggled with internal audit in one way or another, either as auditor or auditee.
And, maybe as a result of a misguided notion about the need to meet internal auditing requirements in standards such as ISO 9001, we have resorted to peculiarities such as: running training courses based on the clauses of ISO 9001 itself; engaging "auditors" from other departments who cannot possibly have the foggiest idea about the intricacies of the processes in the department they're auditing; and empowering auditors with draconian powers to implement solutions to problems that they can't identify.
Perhaps this tree diagram approach brings more meaning to the need for internal audit if indeed there is any need at all.
Maybe internal audit is best used on behalf of each stakeholder to validate the information is presented, in this case, on a monthly basis.
After all, isn't that really what financial auditing has always been about?
Keep up the good work!
For further information contact ian.hendra@clearlineservices.co.nz