Flowcharts

Flowcharts

flowcharts 1

Why use flowcharts? 

To allow a team to identify the actual flow or sequence of events in a process that any product or service follows. Flowcharts can be applied to anything from the travels of an invoice or the flow of materials, to the steps in making a sale or servicing a product.


What does it do? 

  • Shows unexpected complexity, problem areas, redundancy, unnecessary loops, and where simplification and standardization may be possible
  • Compares and contrasts the actual versus the ideal flow of a process to identify improvement opportunities
  • Allows a team to come to agreement on the steps of the process and to examine which activities may impact the process performance
  • Identifies locations where additional data can be collected and investigated
  • Serves as a training aid to understand the complete process


How do I do it?


1. Determine the frame or boundaries of the process
  • Clearly define where the process under study starts (input) and ends (final output).
  • Team members should agree to the level of detail they must show on the Flowchart to clearly understand the process and identify problem areas.
  • The Flowchart can be a simple macro-flowchart showing only sufficient information to understand the general process flow or it might be detailed to show every finite action and decision point. The team might start out with a macro-flowchart and then add in detail later or only where it is needed.


2. Determine the steps in the process
  • Brainstorm a list of all major activities, inputs, outputs, and decisions on a flip-chart sheet from the beginning of the process to the end.


3. Sequence the steps
  • Arrange the steps in the order they are carried out. Use Post-it™ notes so you can move them around. Don’t draw in the arrows yet.

Tip  Unless you are flow-charting a new process, sequence what is, not what should be or the ideal.

This may be difficult at first but is necessary to see where the probable causes of the problems are in the process.


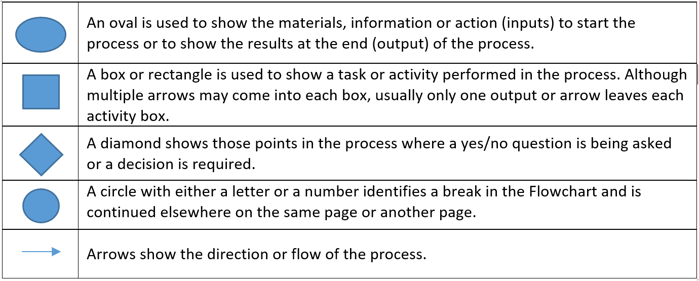
4. Draw the Flowchart using the appropriate symbols

flowcharts


Keep the Flowchart simple using the basic symbols listed above. As your experience grows, use other, more graphic symbols to represent the steps. Other symbols sometimes used include:


Other Quality Tools: 

  • Cause and Effect Diagram 
  • Check Sheets 
  • Control Charts 
  • Histogram 
  • Pareto 
  • Scatter Diagram 
  • Run Chart